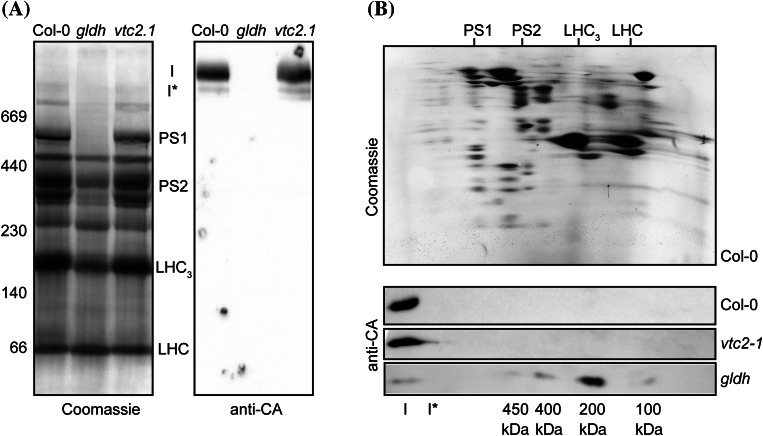
Fig. 4.
Characterisation of complex I assembly in the gldh mutant. Total membranes were purified from Col-0 and the ascorbate-deficient mutants gldh and vtc2-1. a BN-PAGE analysis of membrane complexes. The left panel shows the Coomassie staining of the gel. The right panel shows the western blot analysis using anti-CA antibodies. The sizes of the marker bands of the molecular weight marker used for calibration of the gel are indicated in kDa on the left. The positions of complex I (I), complex I* (I*), photosystem 1 (PS1), photosystem 2 (PS2), the LHC trimers (LHC3) and LHC monomers (LHC) are indicated between both panels. b BN-SDS-PAGE analysis of membrane complexes. Top panel Coomassie staining of a representative gel (obtained for Col-0). The positions of photosystem 1 (PS1), photosystem 2 (PS2), the LHC trimers (LHC3) and LHC monomers (LHC) are indicated on the top. The bottom three panels show western blot analyses using anti-CA antibodies. The plant line analysed is indicated on the right. The positions of complex I (I) and the assembly intermediates detected in the gldh mutant are indicated in the bottom of the panel

