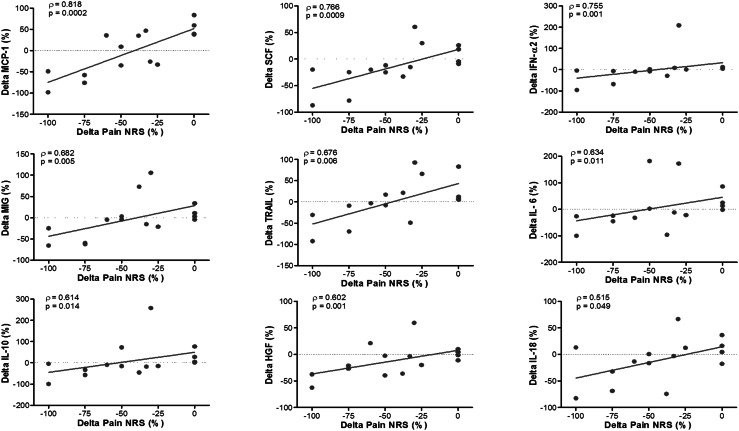
Fig. 2.
Spearman’s correlation coefficient (ρ) and p value for significant correlations observed between % change in pain NRS and % change in systemic mediator levels of MCP-1, SCF, IFN-α2, MIG, TRAIL, IL-6, IL-10, HGF, and IL-18 in all subjects. Each point on scatter plot represents one subject, and line represents the correlation fit

