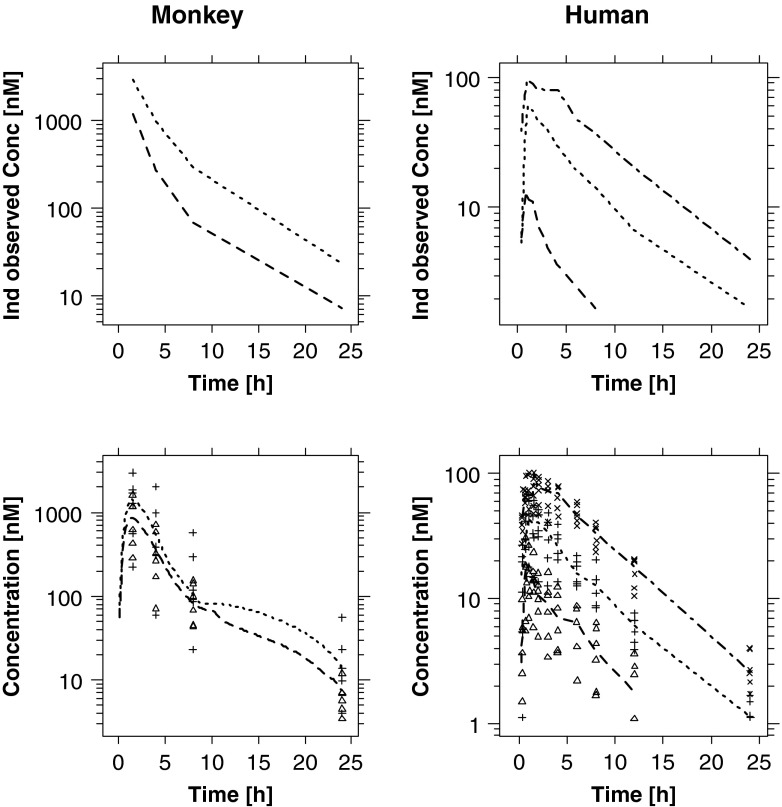
Fig. 2.
(Upper panels) Examples of individually predicted concentrations of NCE05. Lower panels depict the observed (symbols) and mean predicted (lines) concentrations in monkeys and humans. Pre-clinical doses ranged from 25 mg/kg (dashed line/△) to 40 mg/kg (dotted line/+), whereas healthy subjects received doses of 4 mg (dashed line/△), 14 mg (dotted line/+) or 30 mg (dash dotted line/×)

