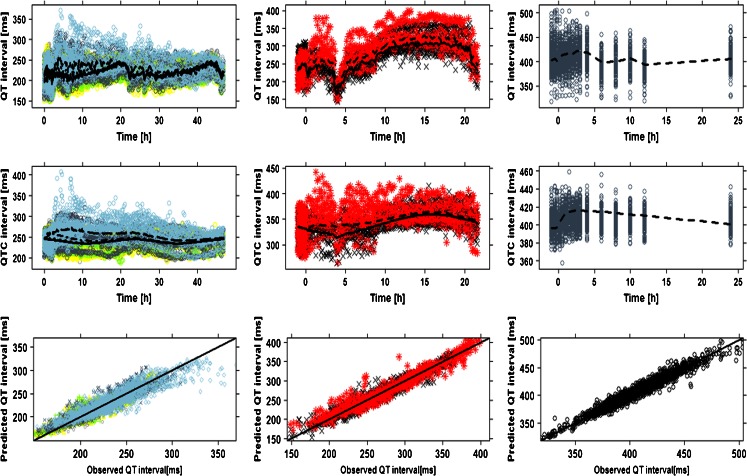
Fig. 3.
Model performance and predicted QT profiles after administration of placebo and different doses of moxifloxacin to dogs (left panels), cynomolgus monkeys (mid panels) and humans (right panels). Observations are indicated by symbols, population predictions by lines. The solid line in the lower panels represents the identity line. In dogs: ○ (grey) and _____ are pre–dose values; △ (yellow) and _ _ _ _ are placebo; + (greenish) and - - - - 3 mg/kg, x(slate grey) and - _ - _ 10 mg; ◊(light blue) and __ __ __ 30 mg. In monkeys: × (black)/solid line are placebo; * (red)/dashed line 90 mg/kg. In humans: dashed line and symbols depict effects of a 400 mg dose

