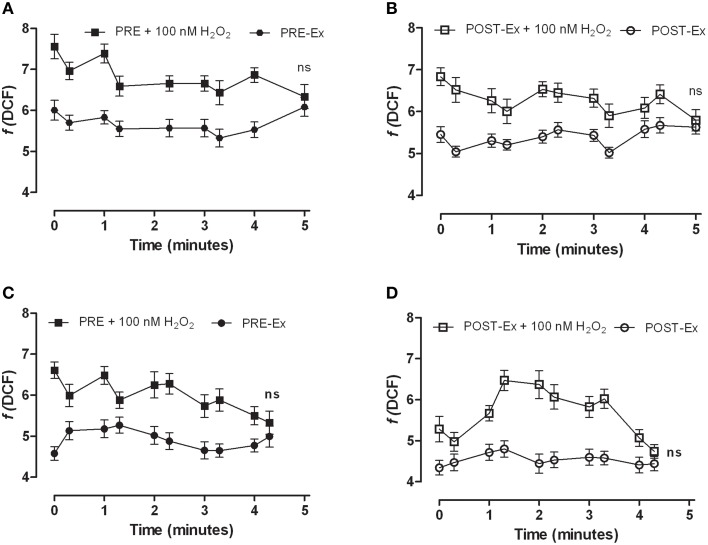
Figure 2.
Kinetics of DCF fluorescence in the control (PRE-Ex; A, C) and POST-Ex (B, D) myoblasts obtained from the skeletal muscle of the women that saw both decreased (A, B) and increased (C, D) production, without and with addition of 100 nM H2O2 (as indicated). The H2O2 was added at 0 min in dedicated samples (+100 nM H2O2). Data came from three independent experiments. All of the ±H2O2 data points were significantly different (p ≤ 0.0001), except after 5 min ns, not significant.

