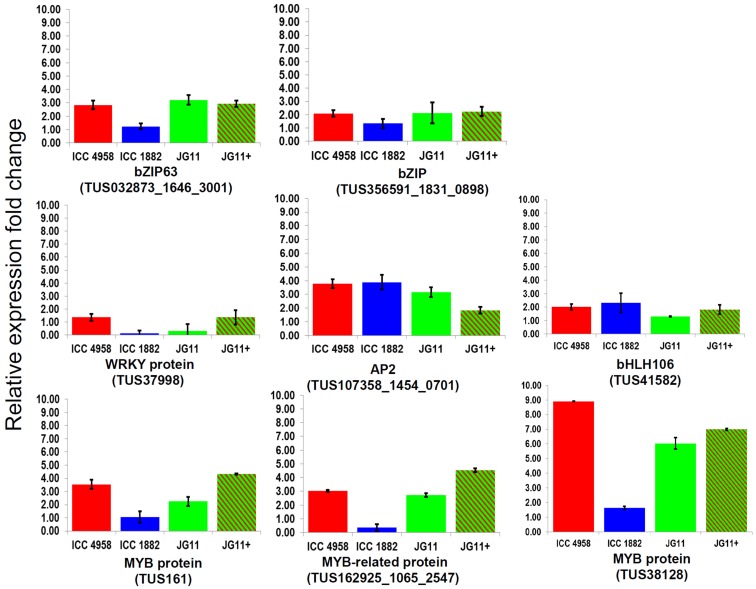
Figure 1.
The relative expression ratio of 8 candidate TF genes analyzed using qRT-PCR under drought stress. The relative expression ratio of each gene was calculated relative to its expression in control sample. GAPDH was used as an internal control to normalize the data. The error bars representing standard deviation were calculated based on three biological and two technical replicates.

