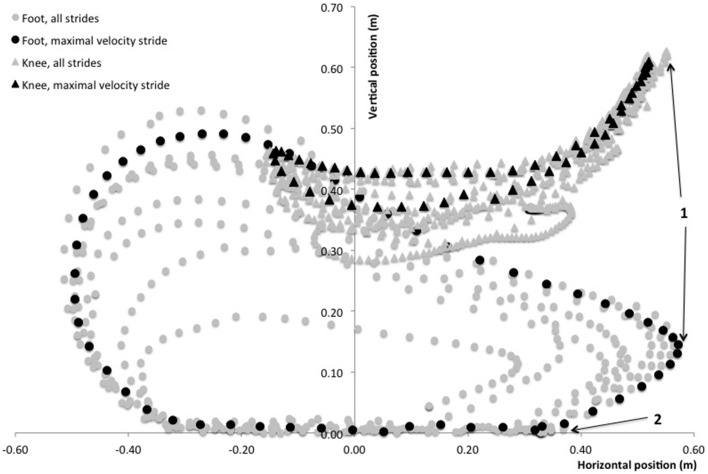
Figure 2.
Typical foot (circles) and knee (triangles) path diagram during an entire sprint treadmill acceleration of a rugby player. The stride at maximal running velocity (9th stride in this trial) is shown with black circles and triangles. Positions are displayed with reference to the treadmill belt frame (vertical axis) and the subject's resting standing position was used for calibration (femoral marker in the horizontal axis). Position 1 indicates the maximal forward position of the foot and knee as retained for analyses. Position 2 indicates the initial foot-ground contact. The path of the foot marker from position 1 to position 2 is considered as the “pawing” backward motion of the foot at the end of the swing phase.

