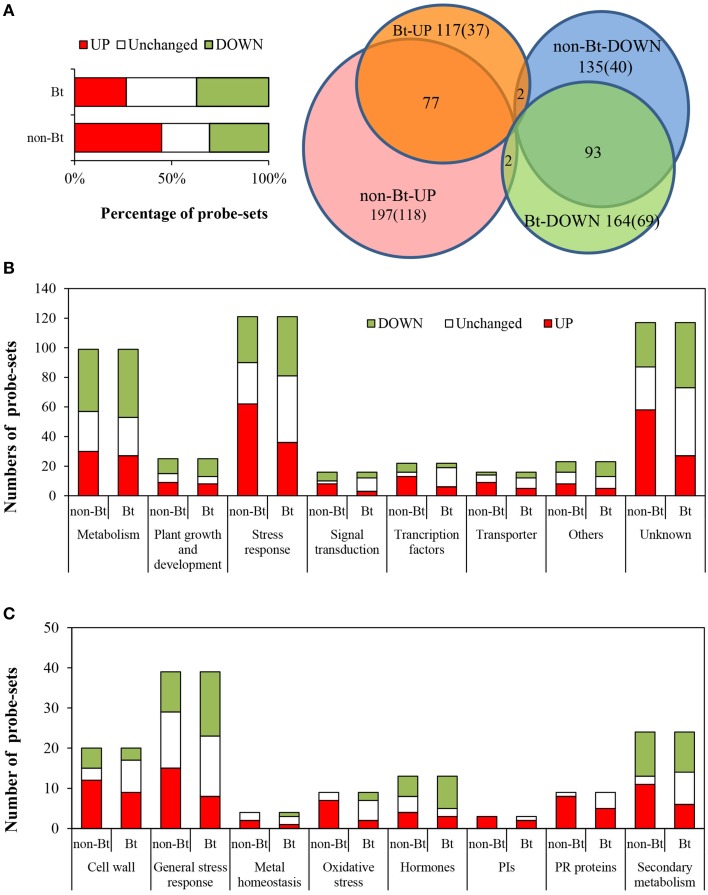
Figure 1.
Analysis of genes with differential responses to BPH between Bt rice and non-Bt rice. The 439 probe-sets showing differential responses to BPH feeding between Bt rice line and the non-Bt parent were classified into eight categories. (A) Left, percentage of upregulated, unchanged, and downregulated genes differing in the response to BPH between Bt rice line and the non-Bt parent; right, Venn diagram. (B) Number of up/downregulated probe-sets in each category. (C) Number of up/downregulated probe-sets related to stress responses.

