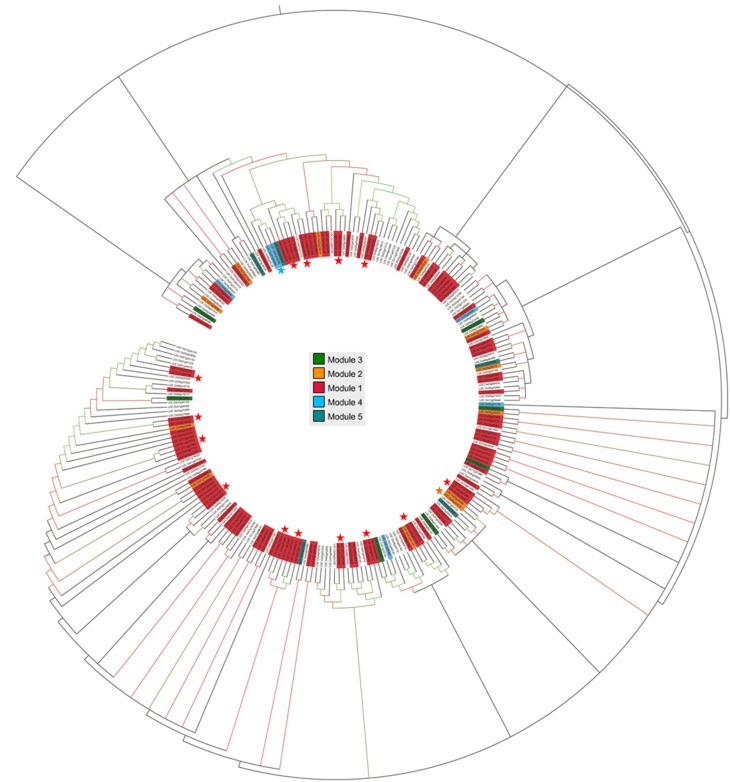
Figure 3.
Phylogenetic tree of OsMYB proteins. OsMYBs lie in module 1 (highlighted in red), module 2 (in orange), module 3 (in green), and module 4 (in blue), were found to be evolutionary related with high bootstrap values. Gene pair marked with star (*) showed their sequence conservation with high boot strap value as well as coexpression which lies in same module. Bootstrap values higher than 80 are indicated by colored nodes (green nodes with >1000 bootstrap value; red nodes with >80 but < 1000 bootstrap value).

