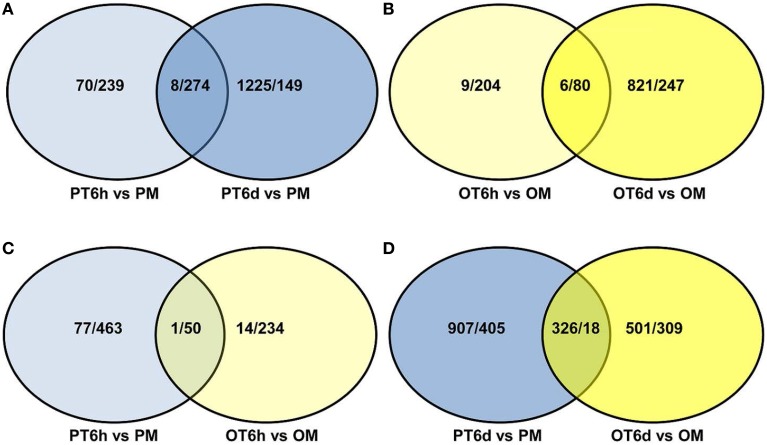
Figure 2.
Venn diagram showing the number of up/down-regulated genes between tomato lines PI 114490 and OH 88119 at 6 h and 6 days post-inoculation with Xanthomonas perforans race T3. PM and OM: PI 114490 and OH 88119 respectively mock-inoculated with the sterile solution containing 10 mM MgSO4·7H2O and 0.025% (v/v) Silwet L77. PT and OT: PI 114490 and OH 88119 respectively inoculated with race T3. (A,B) Comparison of co-DEGs between 6 HPI and 6 DPI in PI 114490 and OH 88119, respectively. (C,D) Comparison of co-DEGs between two tomato lines at 6 HPI and 6 DPI, respectively. Overlapping portion indicates co-regulated genes.

