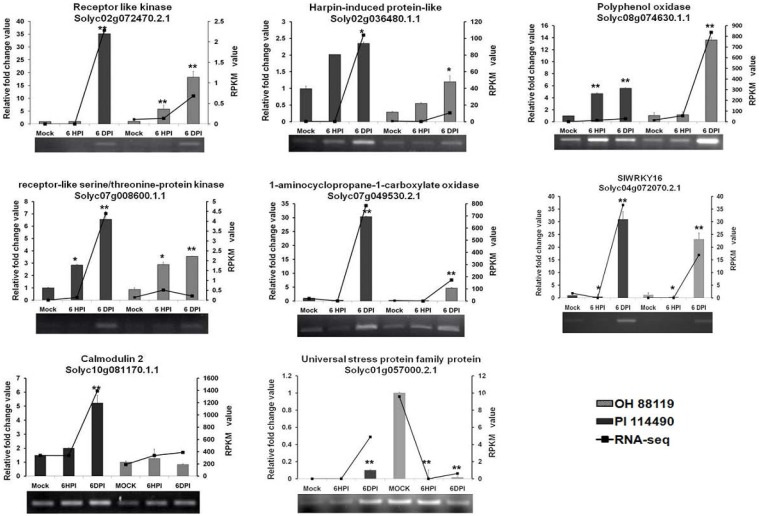
Figure 4.
RT-PCR and qRT-PCR validation of differentially expressed 8 genes related to defense response at 6 h post-inoculation (6 HPI) and 6 days post-inoculation (6 DPI). Expression levels of each sample were normalized on the basis of transcript amounts of EF1-α. Relative expression values for qRT-PCR analysis were determined against the average value of mock sample with PI 114490. Each experiment determined in three technical replicates and standard deviation (n = 3) is represented by error bars. The asterisk above the bars indicates statistically significant differences between the infected samples and corresponding mock samples.

