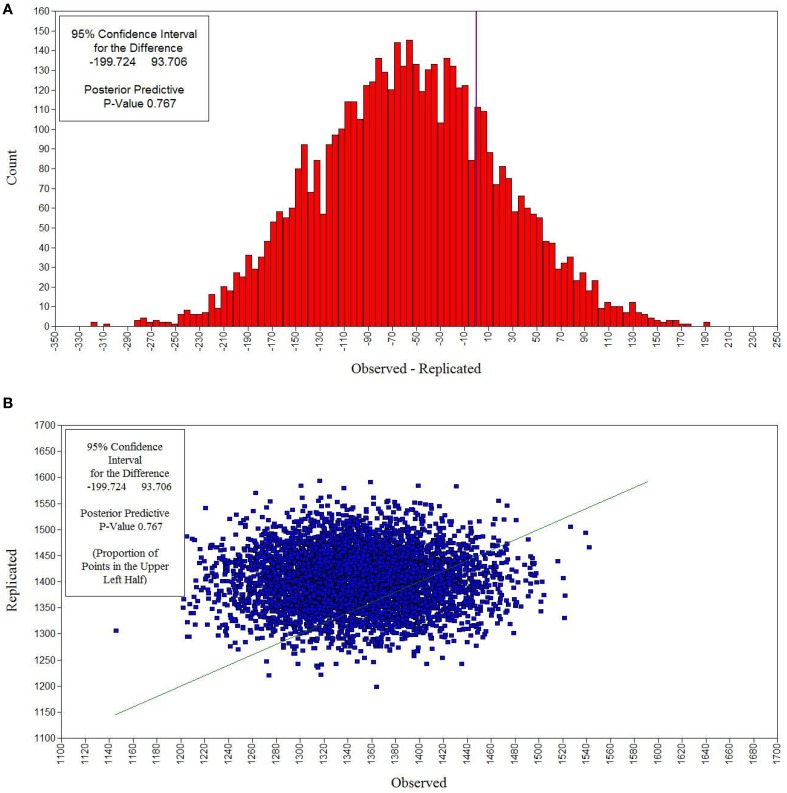
Figure 2.
Bayesian posterior predictive checking distribution plot (A) and scatterplot (B) for the Bayesian model with small-variance priors for cross-loadings and residual covariances for females. In the posterior predictive checking distribution plot, the chi-square statistic for the observed data is marked by the vertical line, which corresponds to a zero value on the x-axis. The matching scatterplot allows determining the PPp as the proportion of points above the 45 degree line.

