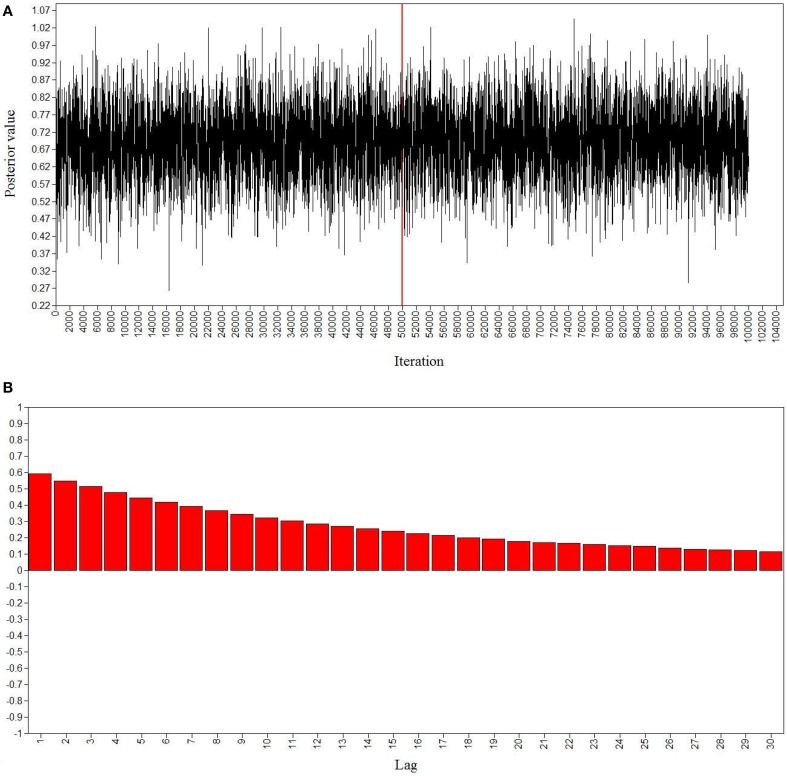
Figure 3.
Bayesian posterior parameter trace plot (A) and autocorrelation plot (B) for the loading of item y10 on intellectual overexcitability in the Bayesian model with small-variance priors for cross-loadings and residual covariances for males. The x-axis of the posterior parameter trace plot displays the iterations of the MCMC procedures and the y-axis shows the corresponding parameter values. The vertical line represents the burn-in phase at 50,000 iterations. The iterations on the right-hand side of the vertical line determine the posterior distribution of the loading estimate.

