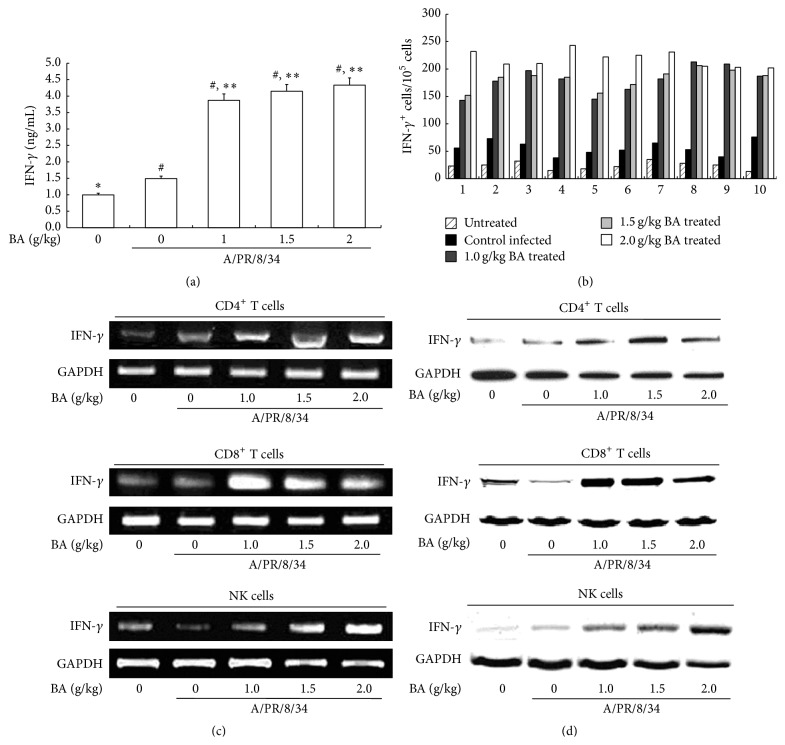
Figure 2.
Effects of BA on IFN-γ production in A/PR/8/34-infected mice. Mice were treated as described in Figure 1. PBMC, CD4+, and CD8+ T cells and NK cells were then sorted on the seventh day. (a) 7 days after infection, IFN-γ in mice serum was calculated by ELISA, and the concentrations were determined from a standard curve. (b) Spot numbers of IFN-γ positive cells were obtained with PBMC from mice survived on the seventh day. 1 × 10⁵ cells were used per well, and experiments were performed in triplicate for each condition. (c) Total RNA was isolated from CD4+ and CD8+ T cells and NK cells and subjected to RT-PCR. The RT-PCR products of mice IFN-γ were analyzed on 1% agarose gel electrophoresis. (d) The cytosol protein was obtained from mice sorted CD4+ and CD8+ T cells and NK cells and analyzed by Western Blotting. #Levels of significance of P < 0.05 against untreated mice; ∗ P < 0.05 against control A/PR/8/34-infected mice; ∗∗ P < 0.01 against control infected mice.

