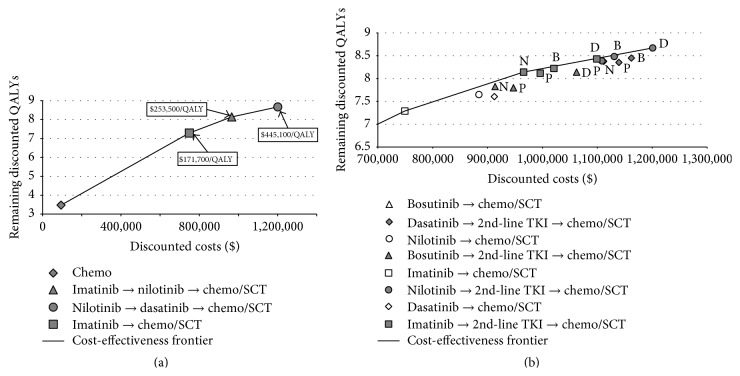
Figure 2.
Cost-effectiveness plane base-case analysis. (a) Cost-effectiveness frontier including only nondominated strategies. (b) Cost-effectiveness frontier including all strategies except chemotherapy alone. Chemo: chemotherapy; QALYs: quality-adjusted life years; SCT: stem-cell transplantation. Letters next to the symbols in (b) indicate the second-line TKI: B: bosutinib; D: dasatinib; P: ponatinib; N: nilotinib; the shape of the symbols explained in the legend beneath the graph indicates the first-line TKI. The cost-effectiveness plane presents simultaneously costs (x-axis) and health outcomes (y-axis). Strategies on the left lower corner of the cost-effectiveness plane are less expensive and less effective compared to strategies on the right upper corner. After eliminating dominated and weekly dominated strategies, four strategies (see (a)) remained defining the so-called cost-effectiveness frontier (i.e., the line in Figure 2): (1) chemotherapy, (2) imatinib→chemotherapy/SCT, (3) imatinib→nilotinib→chemotherapy/SCT, and (4) nilotinib→dasatinib→chemotherapy/SCT.

