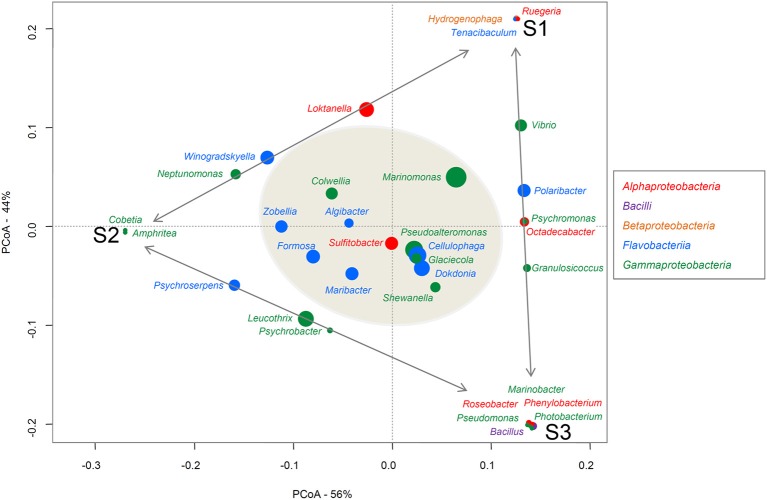
Figure 1.
PCoA of the genera found on the three alga samples. Bacterial classes are indicated in different colors. The size of each spot is proportional to the relative abundance of the genus indicated above or next to it. The closer a spot is to a sample name, the more abundant this genus is in that sample. The Genera common to just to samples are aligned along the gray arrows. The genera identified on the three samples (i.e., the common core) are in the gray shadowed circle.

