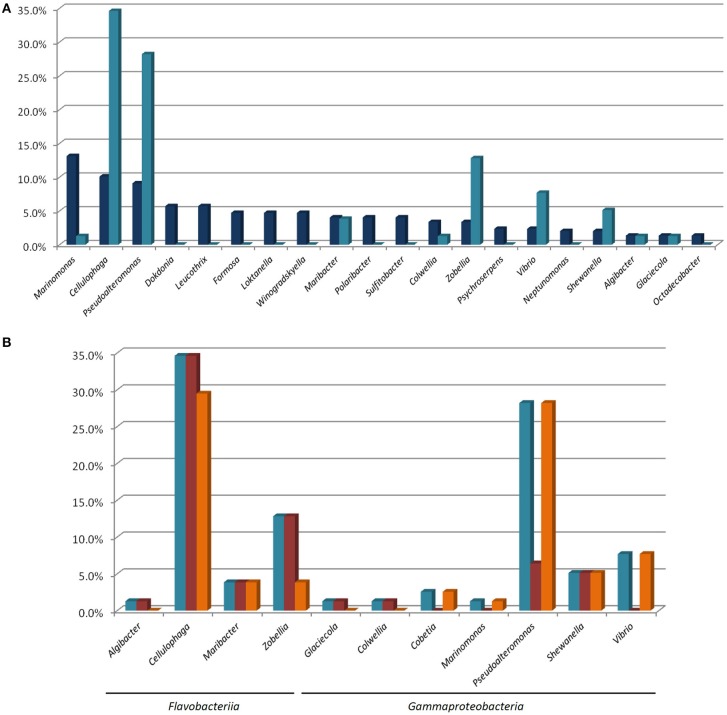
Figure 4.
(A) Percentage proportions of the most represented genera in the total isolated bacterial population ( ) and of the MAPD isolates belonging to these genera in the whole set of 78 MAPD isolates (
 ); (B) Percentage proportions of MAPD isolates belonging to each MAPD-isolate-containing genus in the whole set of 78 MAPD isolates (
 ), with their activities on red (
 ) or brown seaweed galactans (
 ).
).

