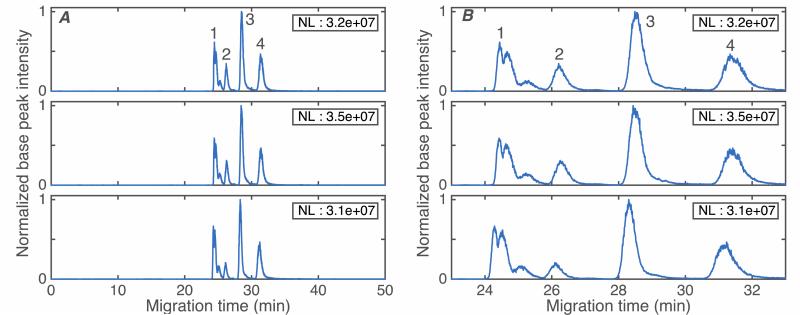
Figure 3.
Base peak electropherograms of four standard proteins: 1 - beta-lactoglobulin, 2 - cytochrome c, 3 – myoglobin, and 4 - carbonic anhydrase in triplicate runs. Data are treated with a Lowess filter with Gaussian kernel and 10 point span. NL is the normalization level, which is the maximum value of the filtered electropherogram. A – full run. B – close-up of the standard proteins. Experimental conditions: BGE: 5% acetic acid, separation voltage: 250 v/cm, sample matrix: 10 mM NH4HCO3(pH 8), sample injection: 500 mbar for 0.2 min

