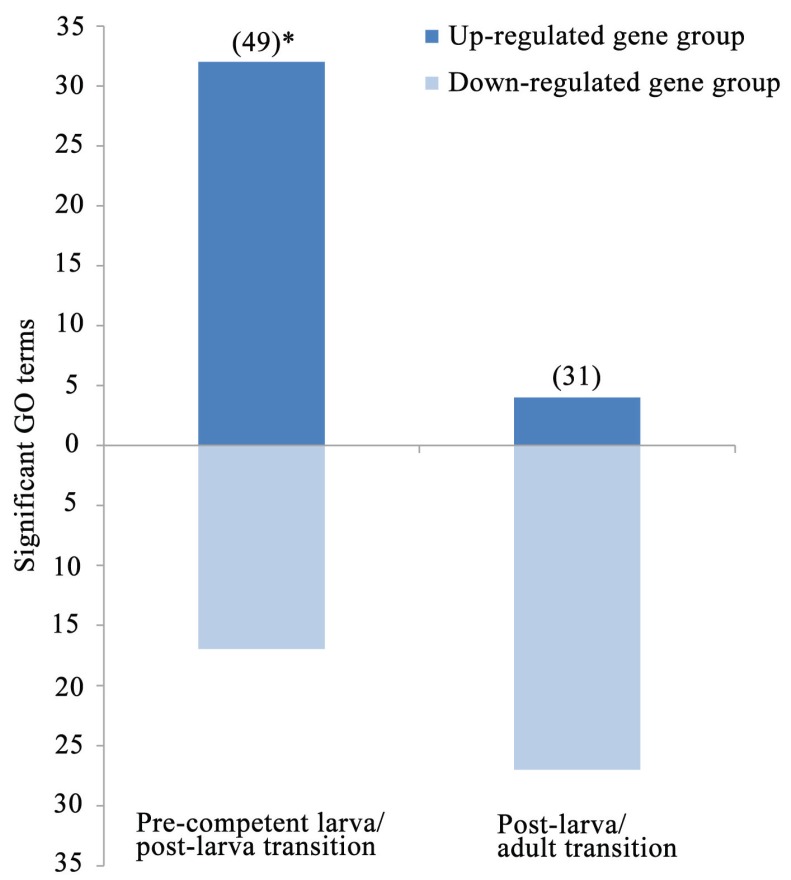
Figure 6.
The frequencies of GO terms with significantly up- or down-regulated gene groups during the two life cycle transitions. These frequencies are for the subsets of 1025 and 716 annotated contigs in Figure 5A with a ≥4-fold expression change during the pre-competent larva/post-larva and post-larva/adult transitions, respectively. ( ) = total numbers of significant GO terms (see Table 3 for a list of these designations); * = significant excess of up-regulated classes at p < 0.0001.

