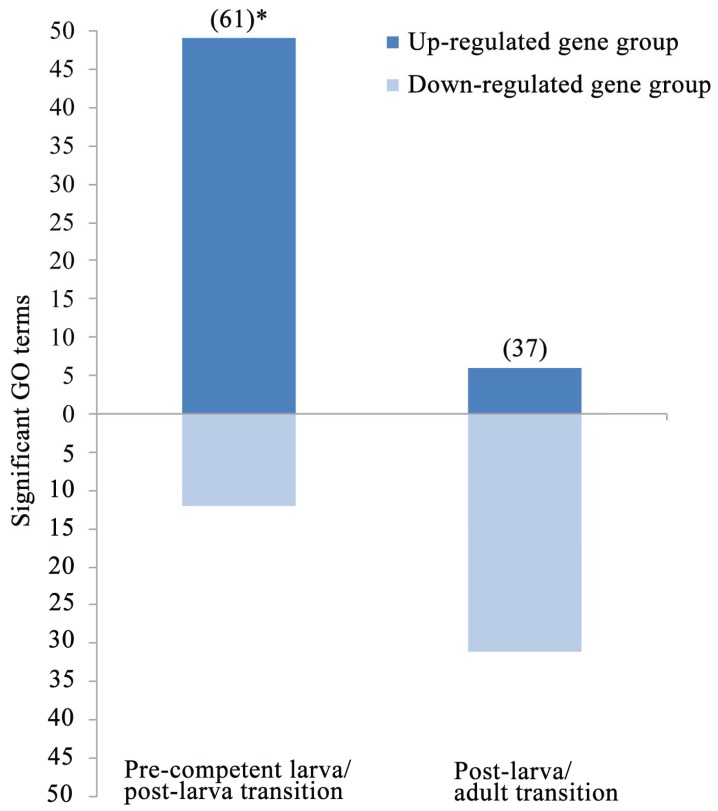
Figure 9.
The frequencies of significantly up- or down-regulated GO terms for the two life cycle transitions according to the read normalization assessment of the third gene expression analysis (Figure 6). In this read normalization assessment, the third gene expression analysis is repeated, but with the three equally sized datasets of raw reads for the three life cycle stages. See Figure 6 for other details.

