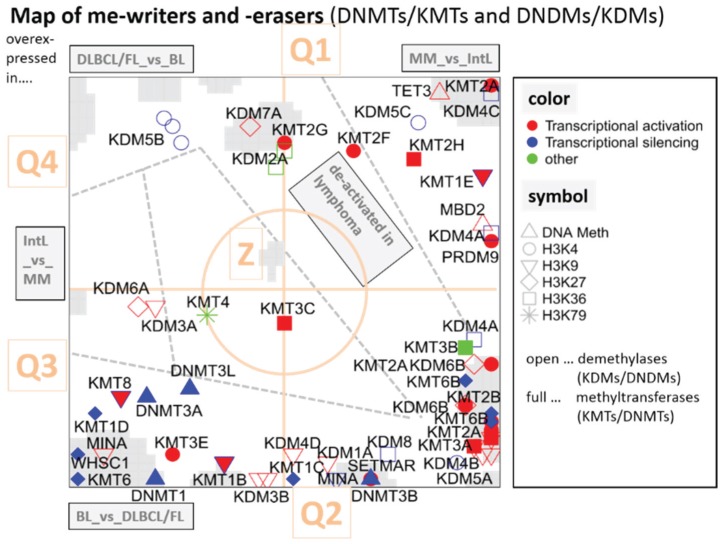
Figure 5.
Mapping of writers and erasers of epigenetic methylation marks into the gene expression landscape (DexSOM) of lymphoma. The map is segmented into regions of specific differential expression between the lymphoma classes by dashed lines. The mode of differential expression is indicated in the grey boxes (e.g., “IntL_vs._MM” contains genes upregulated in IntL compared with MM). So-called spot-clusters of differentially expressed genes are grey-colored. The map is further divided into four quadrants Q1–Q4 and a central region “Z” (see Figure 2 for segmentation of the SOM). Epigenetic modifiers are labeled as shown in the right part of the figure. A few genes are redundant because more than one probe set interrogate them (e.g., KDM4A, KDM6B, KMT6B). The redundant probe sets are located in close proximity reflecting strongly correlated expression profiles (see Table 1 for assignment of the enzymes).

