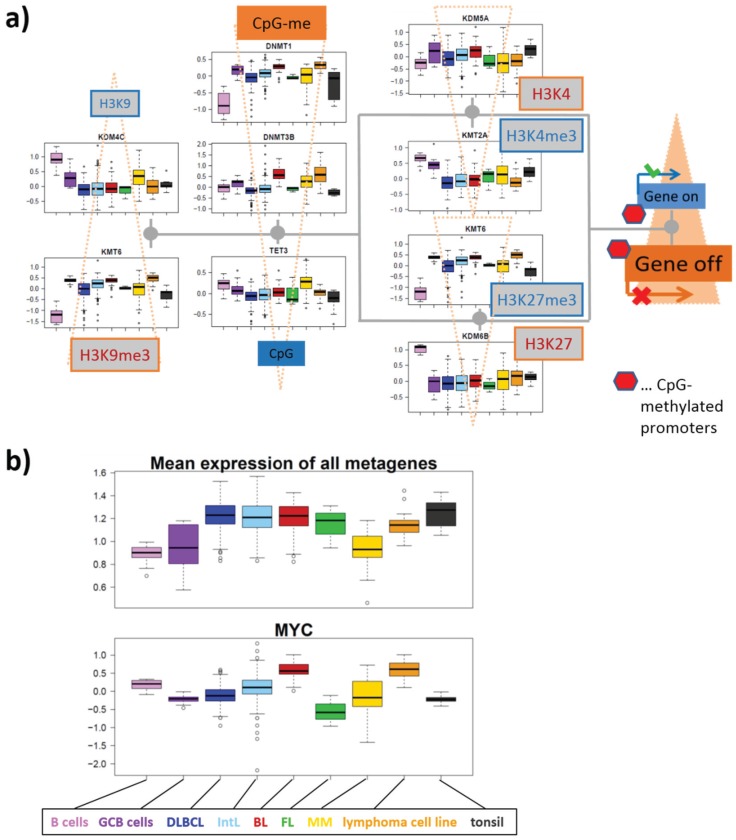
Figure 10.
(a) The expression profiles of the methyltransferases and demethylases of H3K9, H3K4, H3K27 and of DNA-CpG’s suggest a shift of expression of the affected genes towards repressed and CpG-methylated promoter states. The scheme is redrawn from Figure 4 and supplemented by selected expression profiles of the respective enzymes determined from the lymphoma cohort studied. The triangles indicate the shift of the methylation-demethylation reactions in lymphoma compared with B cells deduced from the expression profiles from the respective enzymes. (b) Expression profiles of MYC and of the mean total expression averaged over all SOM-metagenes of each samples. Total expression is consistently activated in lymphoma except MM compared with B and GCB cells, whereas MYC is on high level in BL and IntL carrying genetic activating MYC defects.

