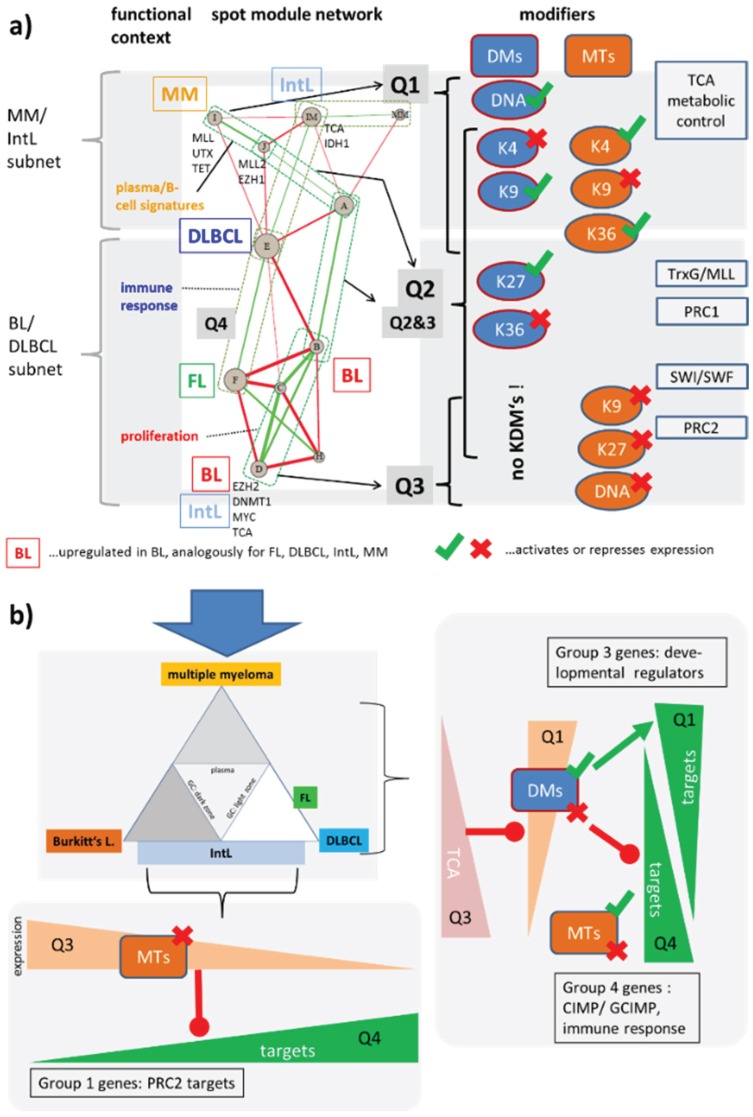
Figure 11.
(a) Network of expression modules governing lymphoma heterogeneity. The nodes refer to the spot clusters extracted from the SOM analysis (for functional assignments see [6]). Green and red edges indicate positive and negative correlations with |w| > 0.3 using the weighted topological overlap correlation measure (see also Figure 2). A “backbone” of correlated modules can be assigned to the Q1–Q3 quadrants of the SOM used to map enzyme activities. Accumulation of different types of modifiers and complexes in Q1–Q3 is shown in the right part. Q4 is almost depleted from modifiers. A detailed list of the modifiers found in each spot is given in Figure S3. The network can be roughly divided into two subnets as described in the text. (b) The DLBCL/BL and MM/IntL subnets explain the expression changes of three different groups of genes identified in [6] (see text).

