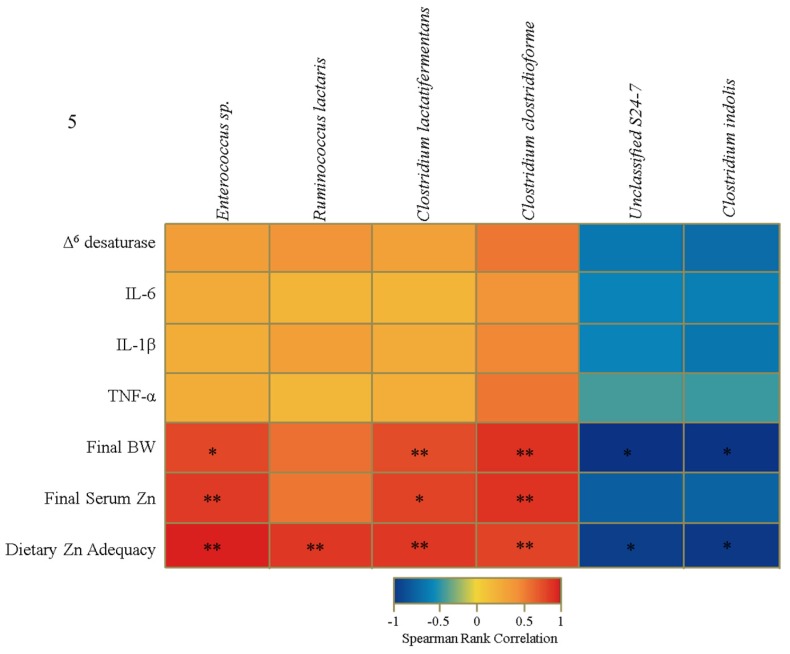
Figure 5.
Heat map describing a set of Spearman correlations, independent of treatment group, between the relative abundance of different operational taxonomic units (OTUs) and select biological indicators of Zn status. The color indicator ranges from a perfect negative correlation (−1, blue) to a perfect positive correlation (1, red) (* p < 0.05, ** p < 0.01, ANOVA).

