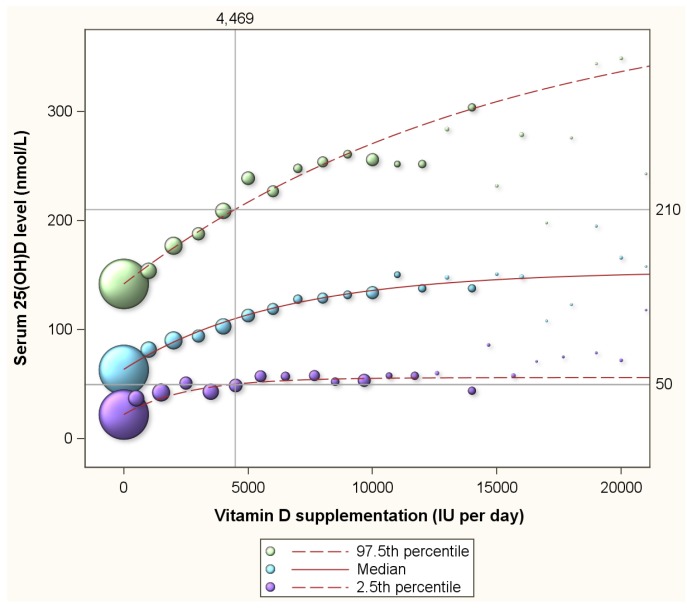
Figure 2.
The median and 2.5th and 97.5th percentiles of serum 25(OH)D concentrations by vitamin D supplementation among 11,693 healthy participants of a preventive health program in Canada. Note: The 2.5 percentile line depicts 25(OH)D concentrations for any given vitamin D supplementation dose with 2.5% of all expected 25(OH)D responses to have values below the line, and 97.5% to have values above the line. The 97.5 percentile line depicts 25(OH)D concentrations for any given vitamin D supplementation dose with 97.5% of all expected 25(OH)D responses to have values below the line, and 2.5% to have values above the line. The area between the 2.5 percentile line and the 97.5 percentile line depicts the 95% prediction interval of 25(OH)D concentrations for any given vitamin D supplementation dose. The median, the 2.5th and 97.5th percentiles were estimated through quantile regression, a statistical approach that accommodates the clearly visible skewness in the distribution of 25(OH)D concentrations.

