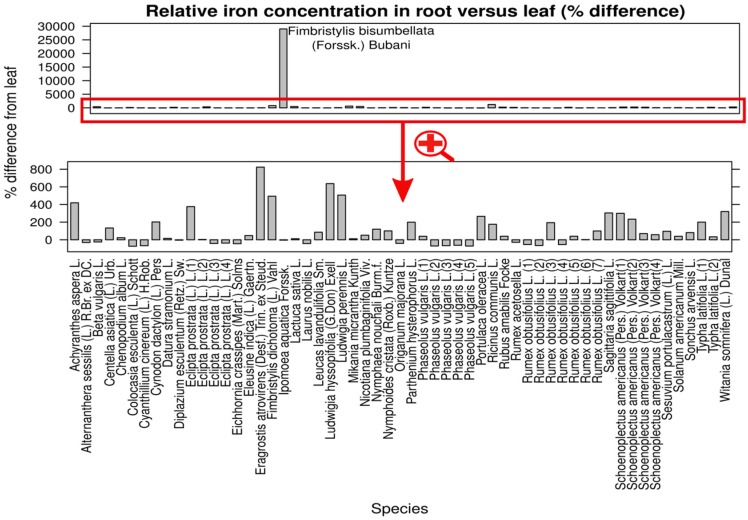
Figure 2.
Iron concentration in root versus leaf. The bars show the differences between iron concentrations in the two organs, computed as percentages from the leaf concentration (bars over zero indicate higher contents in roots, bars under zero indicate higher contents in leaves). A graph with the absolute values is provided as a supplementary electronic material—Figure S13.

