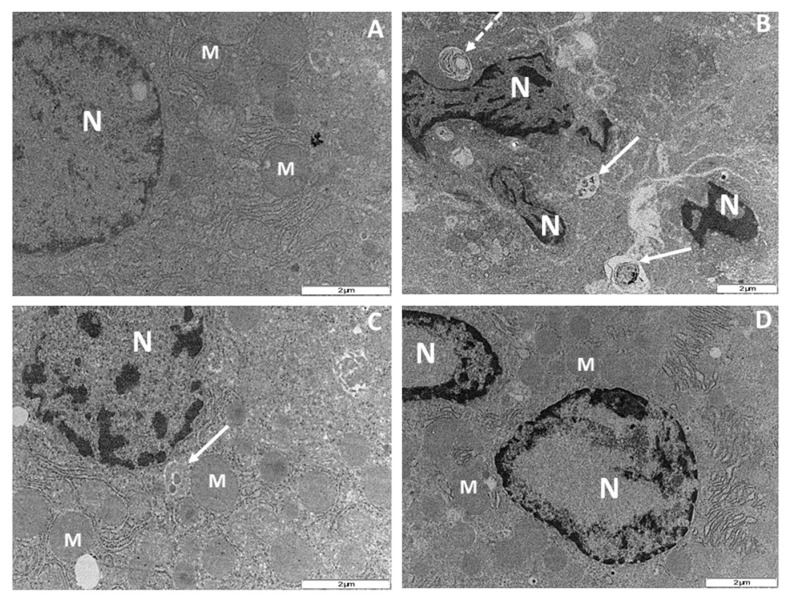
Figure 8.
Transmission electron micrograph of rat hepatocytes after 56 days of drug treatment. M = mitochondrion, N = nucleus and ER = endoplasmic reticulum. (A) Control rats showing normal nucleus with an even distribution of the nuclear chromatin granules, evenly distributed cytoplasm and preserved mitochondrial architecture; (B) d4T-treated rats with severely clumped chromatin granules, broken nuclear membrane and fragmentation of the nucleus. There is an associated condensation of the cytoplasm with appearance of apoptotic bodies (white solid arrows), phagolysosomes (white broken arrows) and sparse mitochondrial population; (C) and (D) d4T + NAR and d4T + VITE-treated rats, respectively with condensed and fragmented nuclear chromatin granules, numerous mitochondria and even distribution of the cytoplasm. (Original magnification of reference scale markings: 2 μm = × 15,000).

