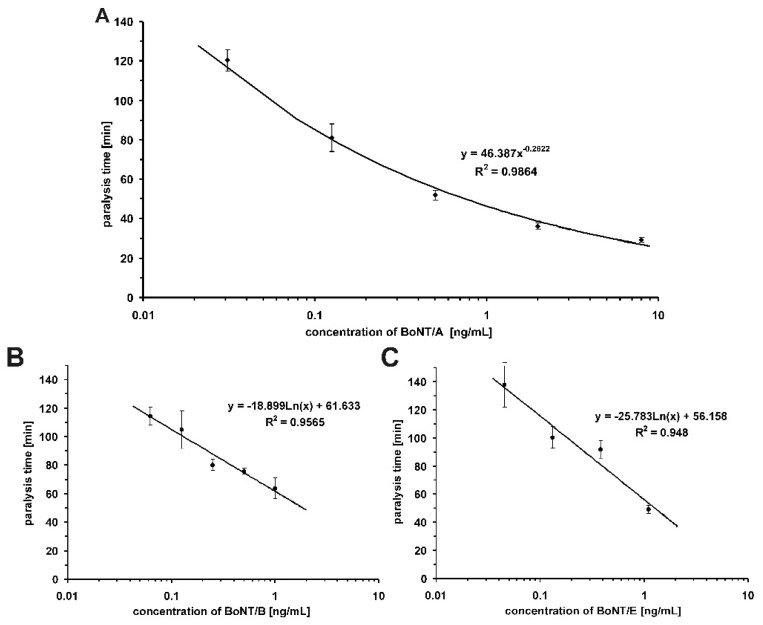
Figure 2.
Calibration curves of BoNT/A (A); BoNT/B (B) and BoNT/E (C), respectively. The bath concentration of the respective BoNT is plotted against the paralysis time. Each data point is the mean of five (BoNT/A) and three (BoNT/B and E) single measurements ±standard deviation, respectively. To these calibration curves, depending on the orders of magnitude of BoNT concentration covered, power or logarithmic functions were fitted and used to quantify the various types of BoNT detected in the samples.

