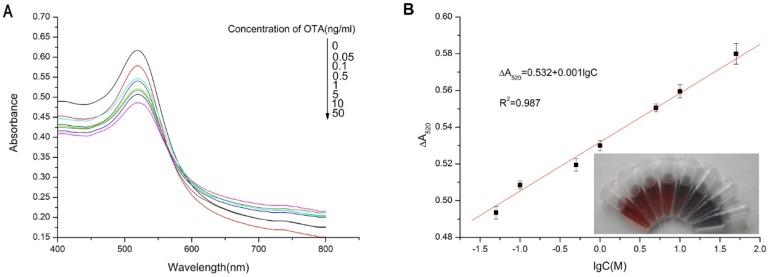
Figure 4.
(A) Sensitivity of aptamer-based assay for OTA detection. The absorbance spectra of sensing solutions treated with 0, 0.05, 0.1, 0.5, 1, 5, 10 and 50 ng/mL OTA; (B) Calibration curve for the assay. Absorbance values were recorded at 520 nm as a function of the logarithm to base 10 of OTA concentration. The curve was fitted to a Hill plot with a correlation coefficient of 0.987. Visible colors of the reaction system with various concentrations of OTA (0, 0.05, 0.1, 0.5, 1, 5, 10, 50 ng/mL).

