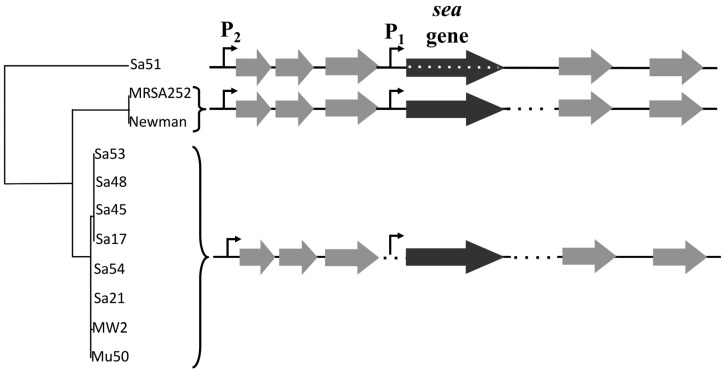
Figure 6.
The sea gene region (3.6 kb long) of 11 S. aureus strains. The black arrow represents the sea gene while the grey arrows represent genes in the surrounding regions. The endogenous sea promoter is marked as P1 and the latent promoter as P2. Observed sequence differences are represented with dotted lines.

