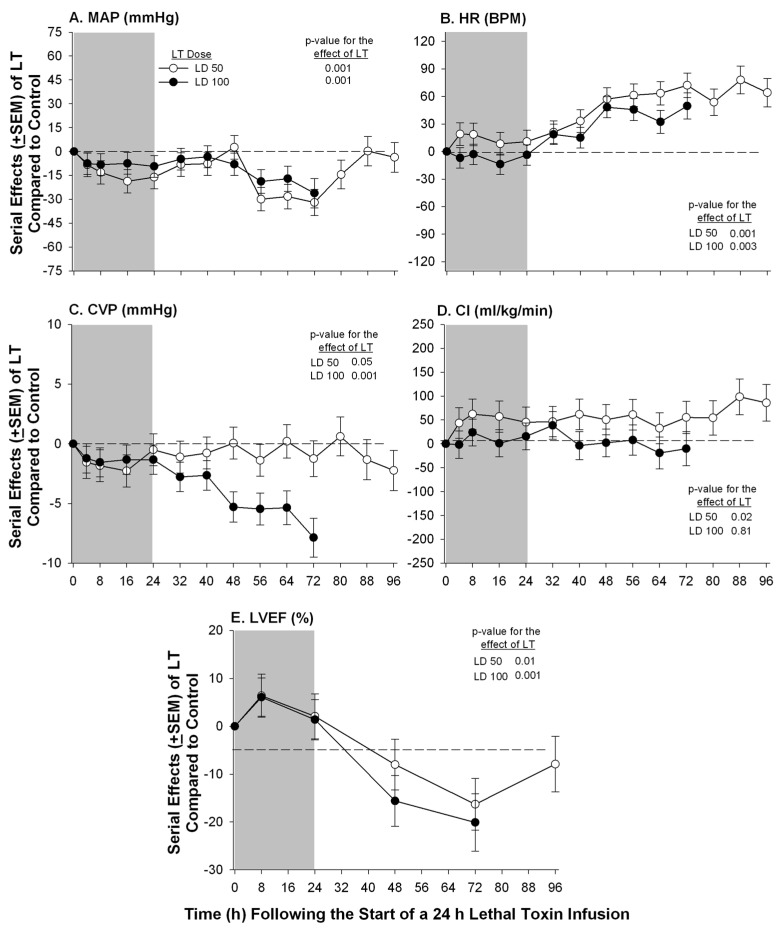
Figure 1.
Serial mean effects (± SEMs) of 24 h infusions (shaded areas) of low (LD50) or high (LD100) doses of lethal toxin (LT) compared to protective antigen alone (controls) on changes from baseline in mean arterial pressure (MAP, panel A), heart rate (HR, panel B), central venous pressure (CVP, panel C), cardiac index (CI, panel D) and left ventricular ejection fraction (LVEF, panel E). The p-values shown are for the effects of LT compared to control. Increases or decreases with LT (compared to controls) are indicated by symbols above or below the dashed horizontal no-effect line respectively.

