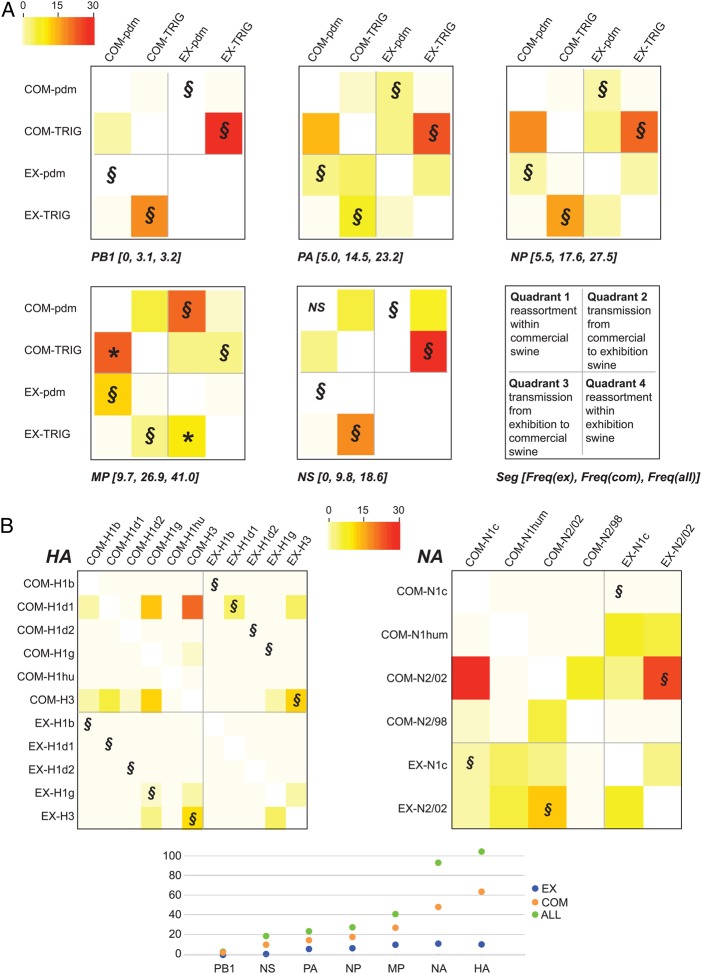
Figure 5.
Heat map of reassortment frequency. A heat map (similar to that in Figure 4A) depicts reassortment between polymerase basic 2 (PB2) and other internal gene segments (A) and the hemagglutinin (HA) and neuraminidase (NA) segments (B). For clarity, the heat map has been divided into 4 sections that represent (I) reassortment events within the commercial swine population, (II) transmission from commercial swine to exhibition swine, (III) transmission from exhibition swine to commercial swine, and (IV) reassortment events within the exhibition swine population. Direct viral transmission events from exhibition to commercial swine (or vice versa) that do not involve reassortment are differentiated by the symbol §. The high frequency of reassortment involving the pdm09 matrix protein (MP) in commercial swine is indicated with an asterisk. For each internal gene segment, the total frequency of reassortment in exhibition swine, commercial swine, and both swine populations is provided in brackets (A) and plotted, along with HA and NA frequencies, in panel B. Estimates for exhibition swine (EX) are blue, those for commercial swine (COM) are orange, and those for the entire population (ALL) are green.

