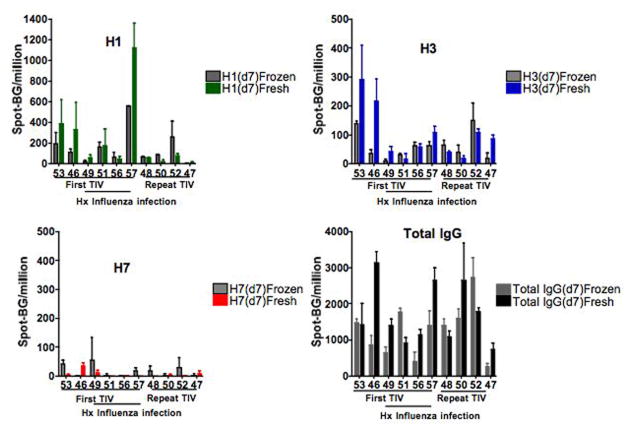
Figure 2.
Comparison of influenza-specific and total IgG ASC frequencies 7-days post TIV vaccine from the same fresh and frozen PBMC sample. All spots shown had background wells subtracted. There was no difference in the fresh and frozen samples for H1- (top left) and H3-(top right) specific ASC spots/106 PBMC from fresh (H1-green, H3-blue) and frozen (corresponding gray) PBMC (Wilcoxian Rank Test, p= 0.43, p=0.28, respectively). Fresh and frozen H7 (bottom right) ASC spots/106 PBMC were minimal and similar. The total IgG (bottom right) ASC spots/106 PBMC were also not different from the fresh and frozen samples (p=0.28).

