
Fig. 2.
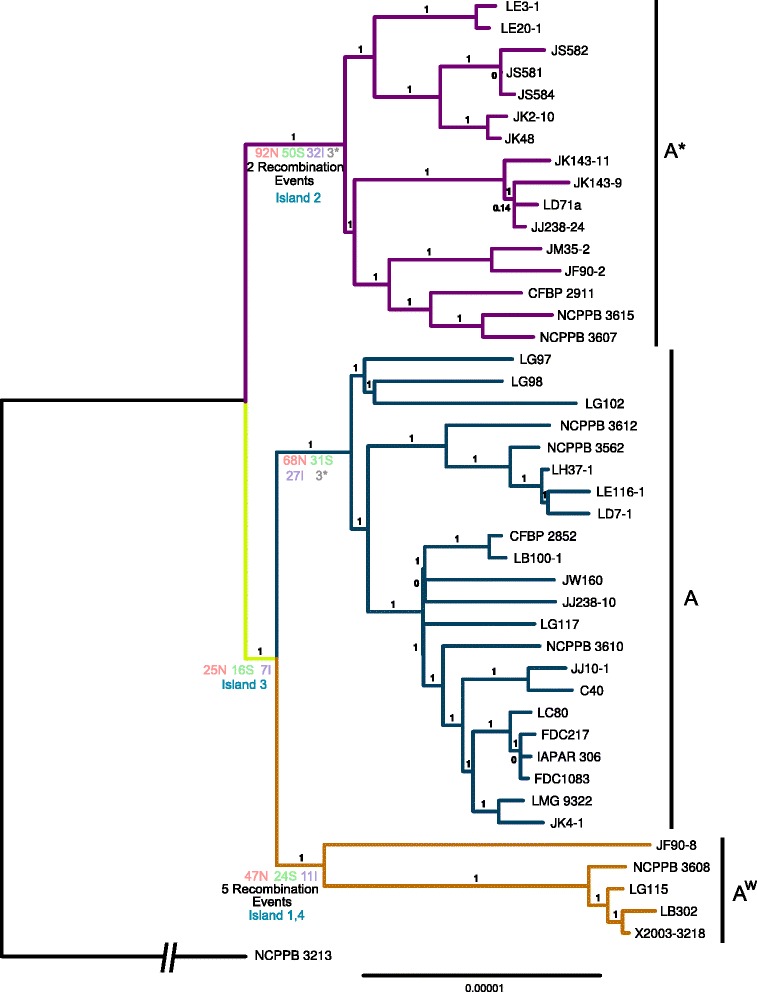
Phylogeny reconstructed from the whole genome alignment with removed regions of recombination. The pathotypes are colored blue (A), mauve (A*) and orange (Aw) and the shared branch ancestral to A and Aw is colored yelow. The number of inferred nonsynonymous (N), synonymous (S), intergenic (I) and nonsense (*) SNPs, gene gains and losses and gene islands are marked along each branch. The outgroup branch has been shortened (indicated by the broken line) and is not to scale, to facilitate legibility of the figure