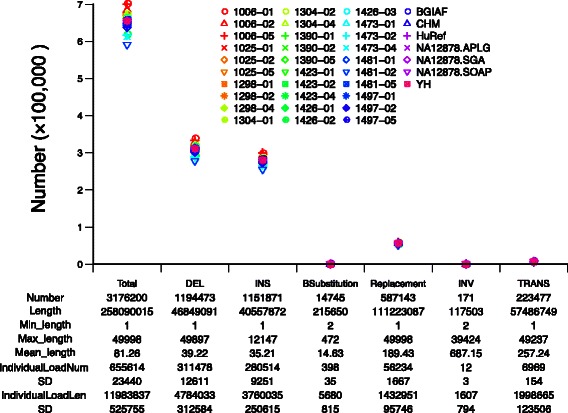
Fig. 2.

AsmVar demo plot of structural variants in the 37 human de novo assemblies. ‘Number’, ‘Length’, ‘Min_length’ and ‘Max_length’ indicate the total number, total length, minimum length and maximum length of structural variants that are present in the 37 human de novo genome assemblies. Also shown are the ‘Individual load’ and ‘standard deviation’ (‘SD’) of both the number and length of structural variants for each type of variant. The dot symbols in the plot indicates individual load
