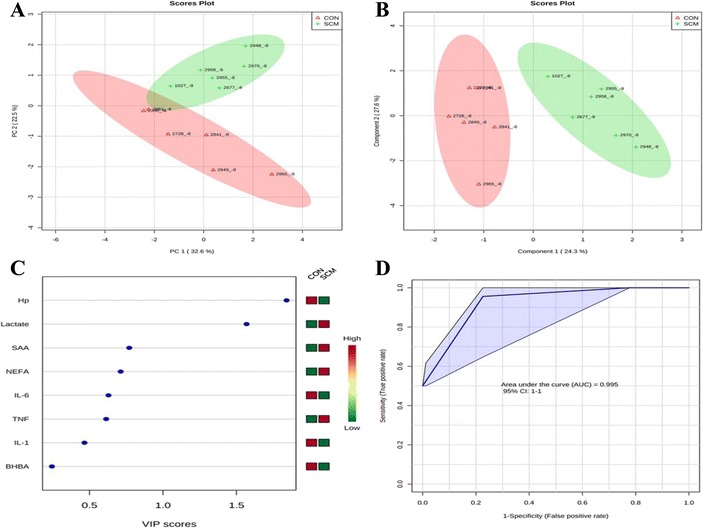
Fig. 7.

a Principal component analysis (PCA) and (b) Partial least squares-discriminant analysis (PLS-DA) of 6 control (red triangles), and 6 subclinical mastitis cows (green + sign), at -8 weeks before parturition showing 2 separated clusters for 2 groups. c Variables ranked by variable importance in projection (VIP), and (d) Receiver-operator characteristic (ROC) curve of 6 CON and 6 SCM cows at -8 weeks before parturition for the top 3 serum variables
