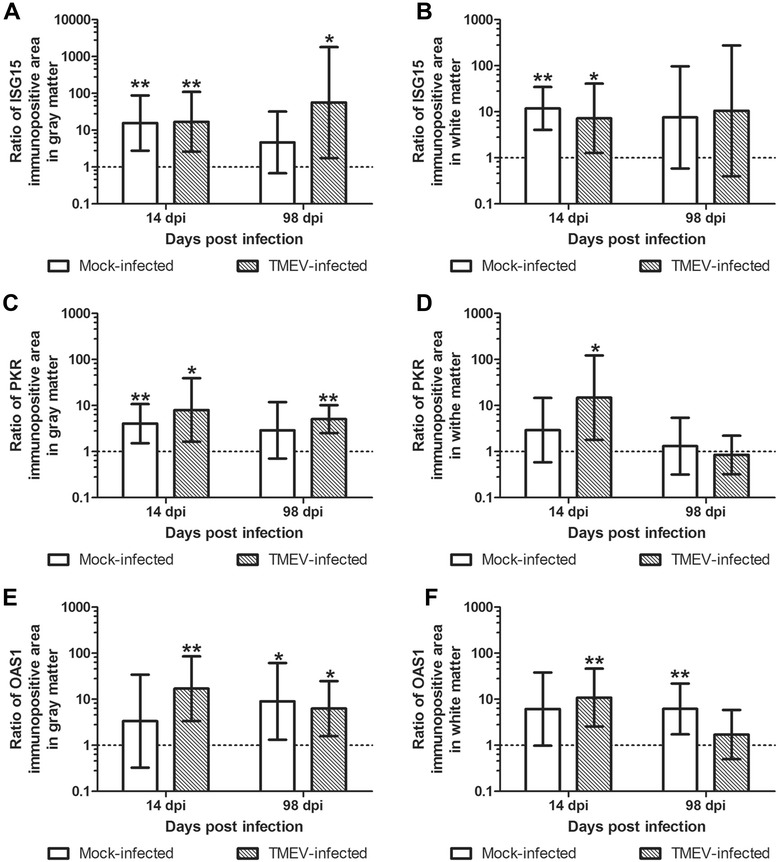
Fig. 4.

Comparison of the ISG15, PKR, and OAS1 protein expression between mock- and TMEV-infected C57BL/6 and SJL/J mice at 14 and 98 dpi. ISG15 (a, b), PKR (c, d), and OAS1 (e, f) protein expression in spinal cord gray (a, c, e) and white matter (b, d, f). Shown are the ratios of the geometric means and 95 % confidence intervals of immunopositive area between C57BL/6 and SJL/J mice using Box-and-Whisker plots and significant differences between groups based on independent T tests (*P ≤ 0.05; **P ≤ 0.01). Note higher protein levels in C57BL/6 compared to SJL/J mice (ratio >1)
