Fig. 1.

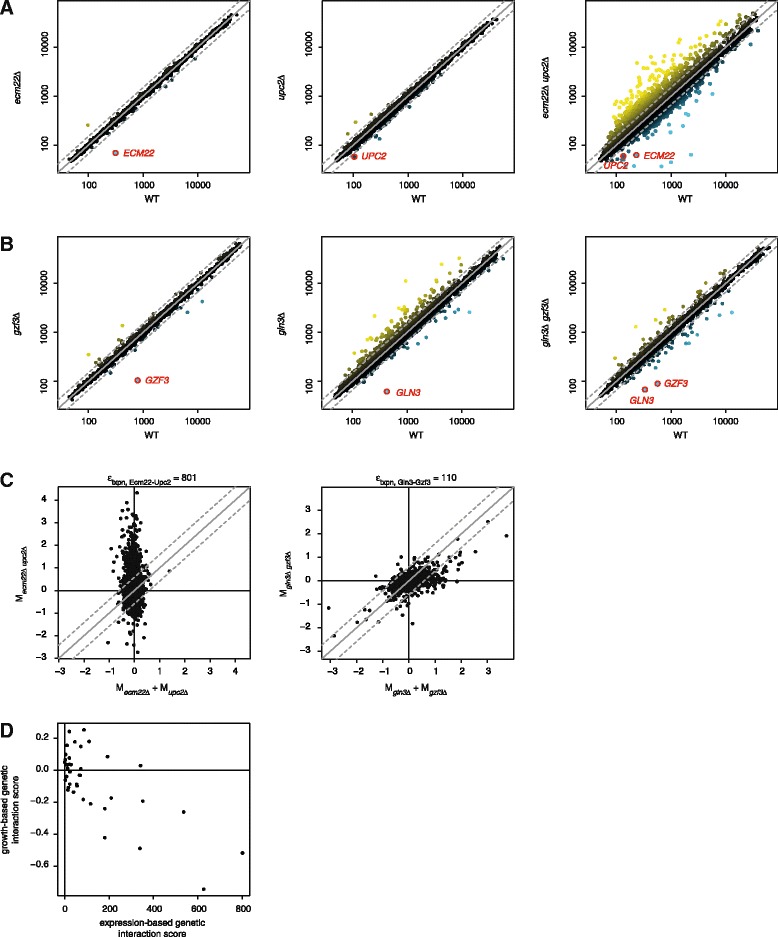
Genetic interactions measured by gene expression. a Genome-wide expression levels in the GSTF deletion mutants emc22Δ, upc2Δ and ecm22Δ upc2Δ (vertical, from left to right) versus reference WT (horizontal). Individual genes are depicted by solid circles, deleted genes are highlighted in red. Color range from yellow for increased expression levels relative to WT, black for unchanged expression, blue for decreased expression. A FC of 1.5 is depicted by a dashed grey line. b Genome-wide expression levels in the GSTF deletion mutants gzf3Δ, gln3Δ and gln3Δ gzf3Δ versus reference WT. Representation as in a. c Expected expression changes (M) in the double mutants ecm22Δ upc2Δ (horizontal, left panel) and gln3Δ gzf3Δ (right panel) versus observed expression changes (vertical). Individual genes are depicted by solid circles. Expected expression changes are calculated as the sum of expression changes in the respective single mutants. A FC of 1.5 is depicted by a dashed grey line. The number of genes outside the FC threshold is stated above each scatterplot. d Growth-based genetic interaction scores (vertical; liquid culture growth) are plotted versus expression-based genetic interaction scores (horizontal). Individual GSTF pairs are depicted by solid circles
