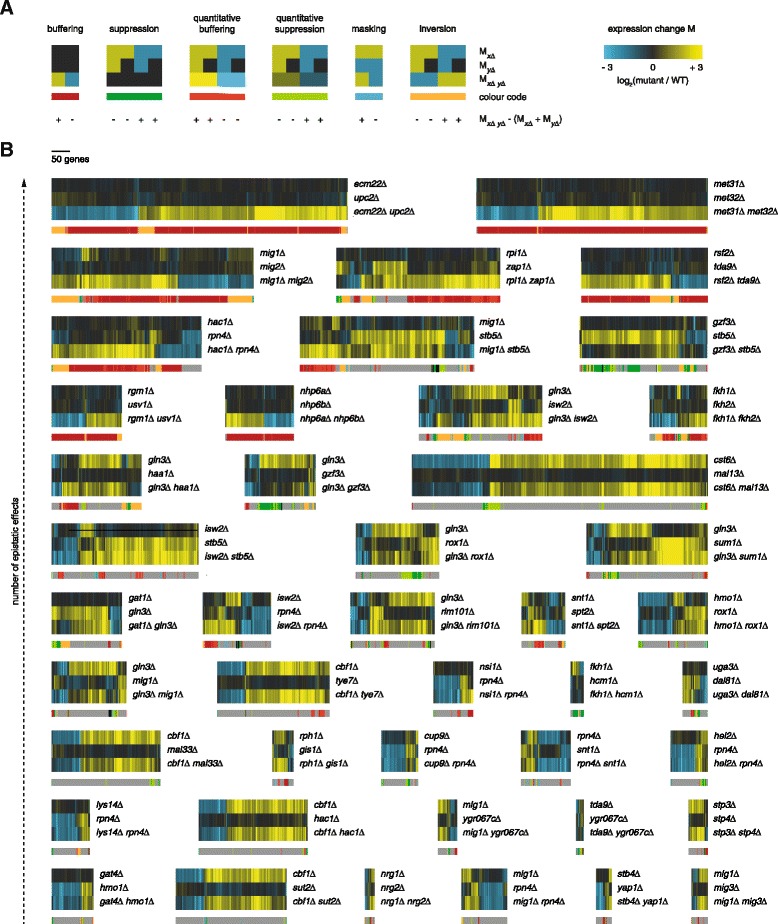
Fig. 2.

Gene expression atlas of GSTF pairs. a Cartoon of expression changes (horizontal) in GSTF single and double mutants (vertical). Color range from yellow for increased expression (P ≤0.01, FC >0), black for unchanged expression (P >0.01) and blue for decreased expression (P ≤0.01, FC <0), as depicted in the top-right corner. Types of epistatic effects are color-coded, shown below the cartoon expression data. At the bottom, it is stated for each expression pattern whether the observed expression change (MxΔ xΔ) is more positive (+) or more negative (−) than expected (MxΔ + MyΔ). b Expression changes (horizontal) in GSTF single and double mutants (vertical). Color range as in a. Types of epistatic effects on individual genes are depicted below the expression changes (colors as in a; grey depicts non-epistatic expression changes). GSTF pairs are sorted according to the amount of epistatic effects (increasing from bottom to top). GSTF pairs with less than ten epistatic expression changes are not shown
