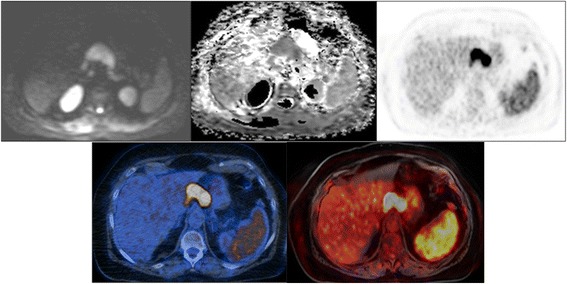
Fig. 2.

A female patient with a diffuse large B-cell lymphoma stage IVB. PET/CT/MRI for initial staging. Top: Axial WB-DW-MRI (b value = 800) and axial ADC map show restricted diffusion in a lymph node conglomerate in the upper abdomen (calculated ADCmean = 0.72 × 10⁻³ mm2/s), but no restricted diffusion in the spleen (calculated ADCmean = 1.37 × 10⁻³ mm2/s). Axial PET shows uptake in the same lymph node conglomerate but also diffuse uptake in the spleen, which was significantly higher than liver uptake. Bottom: FDG-PET/CT and FDG-PET/MRI show FDG avidity in both the lymph node mass and the spleen, indicating lymphoma manifestation
