Fig. 3.

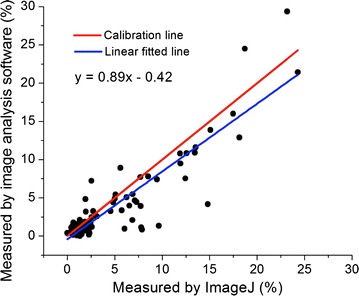
Comparison between the measurements by automated image analysis software and manual measurements by experts on the length of the diseased area. The linear fitted line indicated the deviation from the ideal calibration line

Comparison between the measurements by automated image analysis software and manual measurements by experts on the length of the diseased area. The linear fitted line indicated the deviation from the ideal calibration line