
Fig. 1.
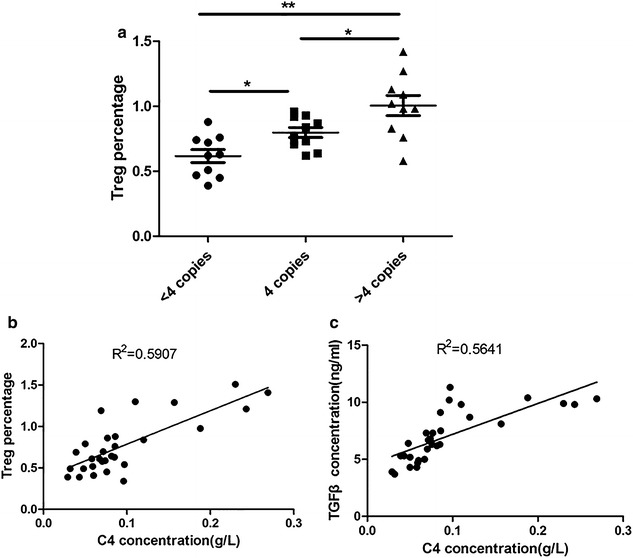
The correlation between serum complement C4 concentration and Treg percentage. a The Treg percentage was detected by flow cytometry; n = 10; the data were expressed as mean ± standard error; *p < 0.05; **p < 0.01. b Spearman correlation was used to evaluate the relationship between Treg percentage and C4 concentration. c Spearman correlation was used to evaluate the relationship between Treg percentage and TGFβ concentration