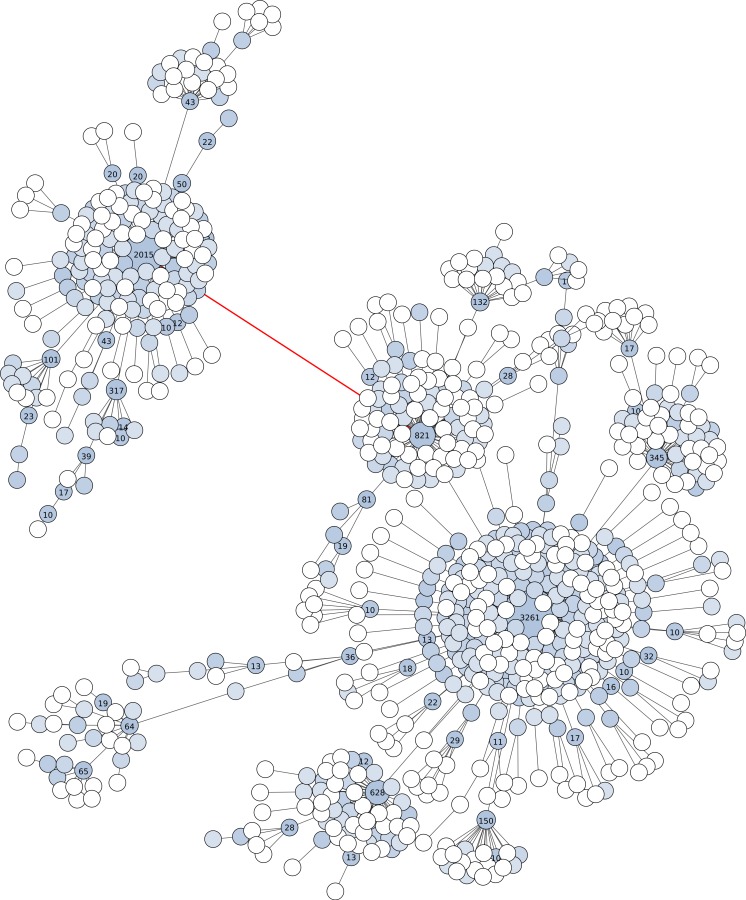
Figure 2. Graphical representation of an OTU produced by Swarm (breaking and grafting phases deactivated) when clustering the BioMarKs 18S rRNA V9 dataset (amplicons are appr. 129 bp in length).
Nodes represent amplicons. Node size, color and text annotations represent the abundance of each amplicon. Edges represent one difference (substitution, deletion or insertion); the length of the edges carries no information. The red-colored edge indicates where Swarm’s breaking phase cuts when it is not deactivated, resulting into two high abundant OTUs, each being assigned to a different genus of Collodaria (Radiolaria).

