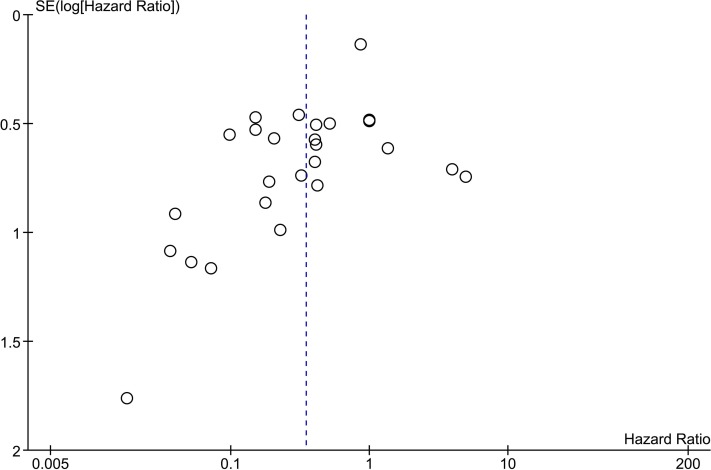
Figure 5. Funnel scatter plot of time-to-event studies.
Hazard ratios with a 95% confidence interval were extracted and used to create a funnel scatter plot using Review Manager. Bullets represent individual experiments from included studies. The x-axis shows the hazard ratio and the y-axis represents the standard error of the log(hazard ratio). The funnel plot is missing studies in the bottom right area in which studies with a negative outcome are expected. Since there are no studies in this area, publication bias is suggested.

