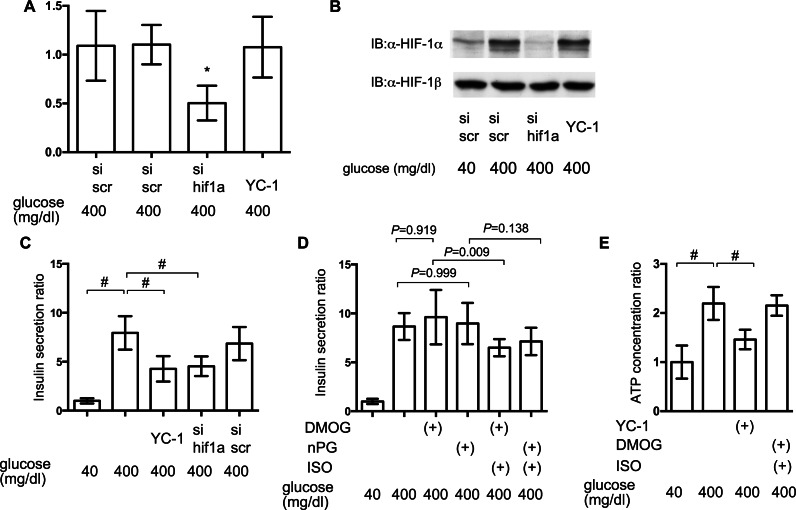
Figure 7. Impact of HIF-1 inhibition on GSIS.
(A) and (B) MIN6 cells were transfected by 100 nM siRNA using HiPer-Fect™ Transfection Reagent (Qiagen, Valencia, CA, USA) or treated with YC-1. Cells were harvested for semi-quantitative real-time PCR for HIF-1α (A). Cells were harvested and whole-cell lysates were immunoblotted (IB) to detect HIF-1α and HIF-1β proteins (B). (C) and (D) MIN6 cells were incubated with the indicated glucose concentrations for 1 h, with or without the indicated compounds, prior to determination of insulin secretion. Data are presented as the mean ± SD (N = 2, n = 6); #P < 0.05 for comparison of the indicated groups. (E) MIN6 cells were exposed to the indicated glucose concentrations and compounds for 2 h prior to analysis of the cellular ATP concentration, as described in ‘Materials and Methods’. YC-1: 5-[1-(phenylmethyl)-1H-indazol-3-yl]-2-furanmethanol. Data are presented as the mean ± SD; #P < 0.05 for comparison of the indicated groups. N, number of independent experiments performed; n, number of samples.

