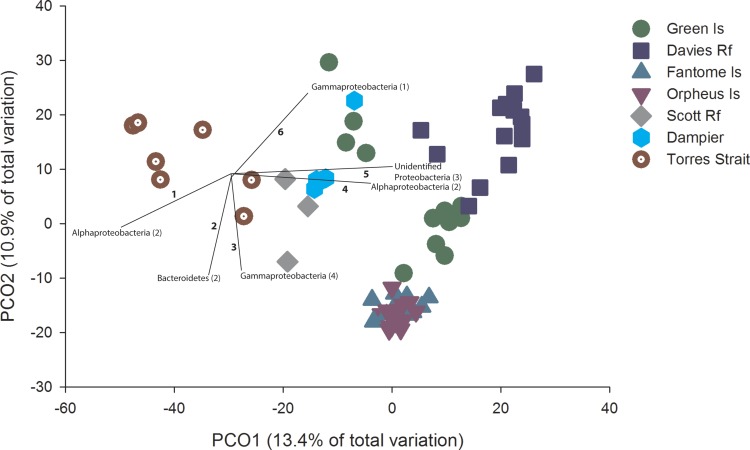
Figure 2. PCO with OTU vectors.
PCO based on the Bray Curtis similarity of the OTUs derived from Illumina sequencing of C. foliascens individuals from each location. Phyla with a Spearman Rank correlation greater than 0.8 are overlaid on the plot as vectors, with the number of corresponding OTUs listed in parentheses and identified in Table S3.

