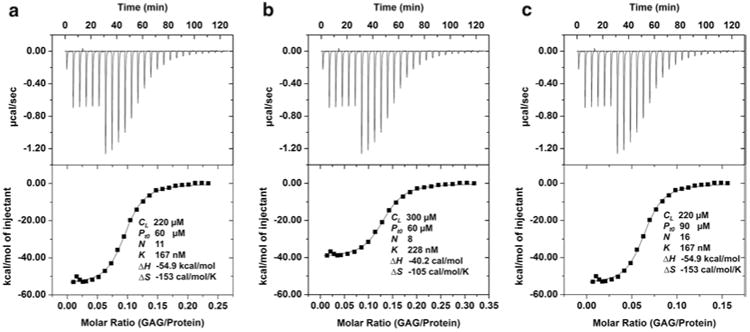
Fig. 2.

Relationship between concentration errors and thermodynamic parameters. (a) The protein (Pt0) and GAG (CL) concentrations were 60 and 220 μM, respectively. The first six injections were 2 μL and the rest were 4 μL. The stoichiometry (n), equilibrium dissociation constant (Kd), enthalpy and entropy data are shown. (b) An error of increased GAG concentration affected the values of all thermodynamic parameters. The stoichiometry and enthalpy decreased proportionally, and ΔS value also changed due to changes in ΔH and Kd. Note that the stoichiometry is protein/GAG. (c) An error of increased protein concentration affected the value of stoichiometry alone and all other values remained unchanged
