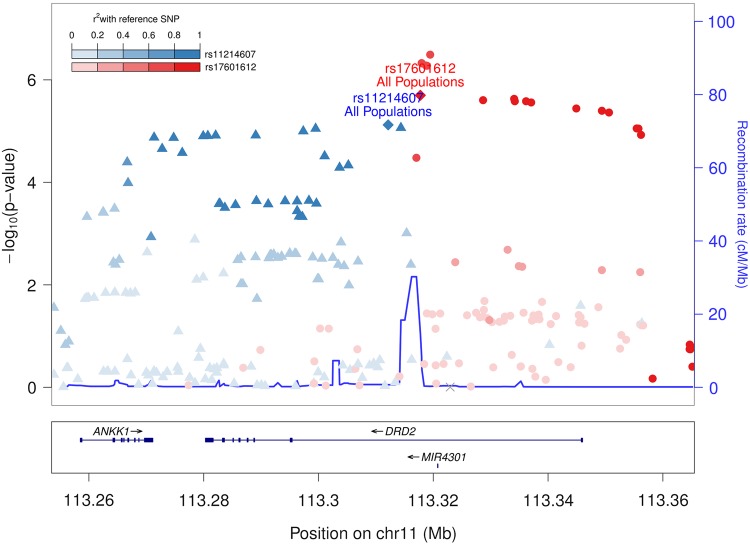
Figure 1.
Regional association plot of DRD2 Sleep duration multi-ethnic association results for the discovery sample. −log10 P-value of the multi-ethnic (AA + AsA + EA + EA) association results is plotted on the y-axis, and chromosomal position is plotted on the x-axis encompassing the DRD2 locus. Individual directly genotyped SNPs are binned based on the stronger linkage disequilibrium relationship with either rs17601612 (blue) or rs11214607 or (red). Note the recombination hotspot separating the two independent association signals. LD was calculated based on 1000 Genomes European population data.

