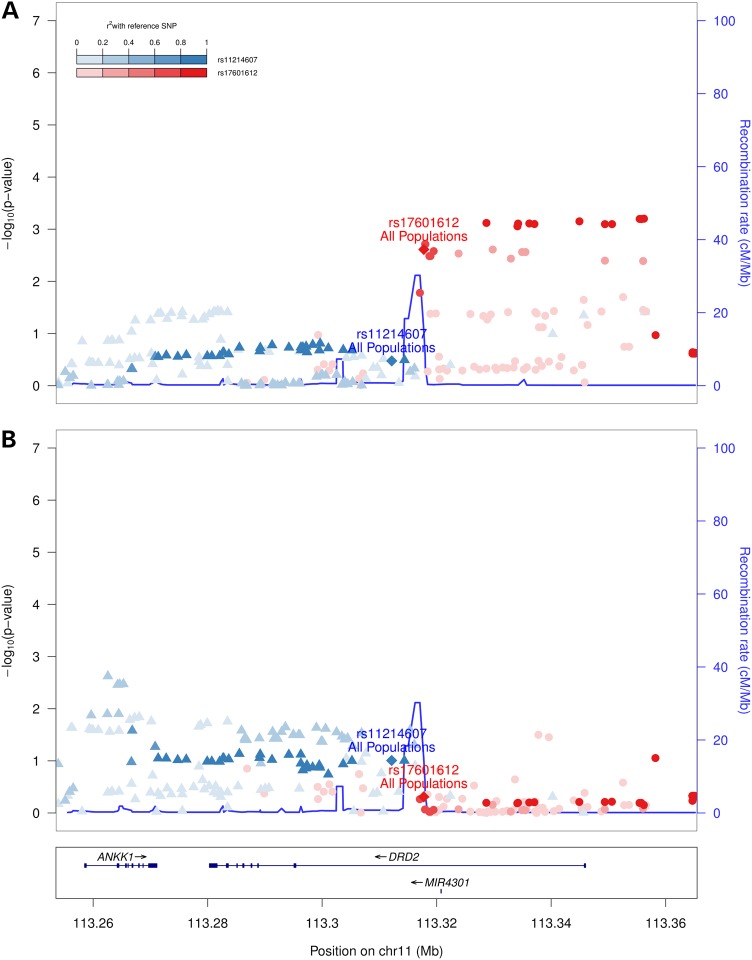
Figure 2.
Regional association plot of DRD2 multi-ethnic association results for sleep latency and Stage 1 sleep. Combined AA–EA results are shown for each trait: (A) sleep latency and (B) Stage 1 sleep. Phenotypes were collected on a subset of Sleep Heart Health Study I (ARIC, CHS, FHS) and CFS participants. rs17601612 and rs11214607 results are listed in Supplementary Material, Table S7. The axes and linkage disequilibrium pattern are as presented in Figure 1.

