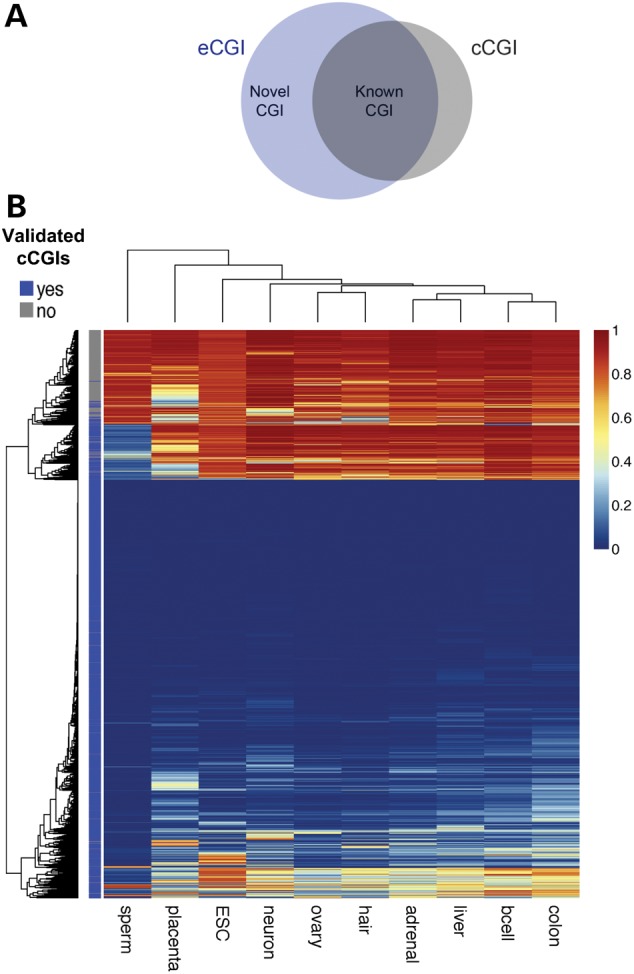
Figure 2.

(A) Venn diagram showing the overlap between eCGI and cCGI sets. (B) Heat map of CpG methylation patterns at cCGIs. cCGIs validated by whole-genome DNA methylation maps are labeled as dark blue, and not-validated cCGIs are shown in gray. Methylation levels are shown as a gradient (blue to red).
